
How to Calculate Descriptive Statistics in Excel
How to calculate descriptive statistics in excel is a common questions asked more than 4,000 times in a month on google. In Excel, user can easily calculate descriptive statistics by using the Analysis Tool Pack. Descriptive statistics tells us the basic information about our data set. The Descriptive statistics of Analysis Tool Pack generates mean, median, mode, standard deviation, kurtosis, skewness, minimum, maximum, the smallest, and the largest value in the data set.
In this section:
- What is Descriptive statistics?
- Check whether you already have the Analysis Tool Pack Installed.
- How to Install Analysis Tool Pack.
- How to Calculate Descriptive Statistics in Excel
- How to Calculate Descriptive Statistics in STATA
- More Related Readings

1. What is Descriptive Statistics:
Descriptive statistics tells us the basic information about our data set. The Descriptive statistics of Analysis Tool Pack generates mean, median, mode, standard deviation, kurtosis, skewness, minimum, maximum, the smallest, and the largest value in the data set. In short, the descriptive statistics is a table that paints a picture of the data set’s properties. Using Excel Analysis Tool Pack, users can easily calculate the Descriptive Statistics. In this section, we discuss how to perform this task in a step by step manner.
2. Check whether you already have Analysis Tool Pack Installed:
To check whether your Excel already have the Analysis Tool Pack Installed, follow the steps below:
Step 1: Click on Data Tab–> Then look at the upper right-hand corner of the Ribbon.
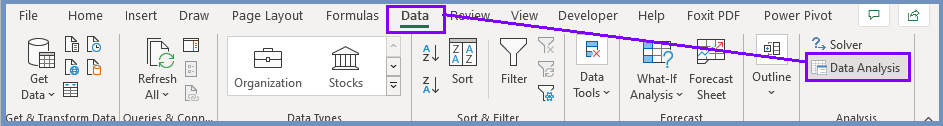
Step 2: If you already have the Analysis Tool Pack Installed, you will see the “Data Analysis” as you can see the image above.
If you do NOT have the Analysis Tool Pack Installed, you will not find the Data Analysis Tab on the upper right-hand corner of the Ribbon.
3. How to Install Analysis Tool Pack in Excel:
To install Analysis Tool Pack in Excel, follow the steps below:
Step 1: Click on File Tab–> then click on Options. Now you see the Excel Options dialogue box as follows.

Step 2: Click Add-ins (as 1 in the image below)–> Click on Go (2 in image)–> click OK (3 in image).

After clicking OK, you can see the following Add-ins dialogue box, and see that Analysis ToolPack is unchecked.
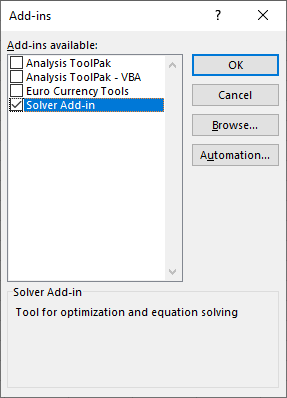
Step 3: Check all the unchecked Add-ins available as shown in the image below:

Step 4: Finally, you can now check your Analysis ToolPack. Click on Data Tab –> Look at the Top-right corner of the Ribbon. You can now see the Data Analysis just below Solver (as in image below)

4. How to Calculate Descriptive Statistics in Excel:
To calculate descriptive statistics, we will use the COMP Data file, which can be downloaded from the Download button below. Follow the steps below:
Step 1: Start the Tool Pack:
Click Data (1) –> Data Analysis (2) –> Descriptive Statistics (3) –> OK (4)

Step 2: After clicking OK, you will see the Descriptive Statistics dialogue box as follows.

Step 3: Complete the following actions:
- Input Range: In our example data set, we select B1:C33.
- Grouped By: Column
- Check Labels in the First Row [Because we have selected the range with the names of the variables]
- Output Range: Give a reference to a cell in which you want to populate the results. In our example, we have referred to F6, in which the results will be generated.
- Summary Statistics: Check Summary statistics to generate the descriptive statistics.
- Click OK.
After clicking OK, you will see that a Descriptive Statistics table is created as follows:

Step 4: Format the Descriptive Statistics Table:
After having the Descriptive Statistics table, you should format the decimal points for better visibility, and you may also like to change the font type and color. For example, to set the decimal point to 3 digit, (1) Select the range, (2) Click on Number , (3) Select 3 decimal places, (4) Check 1000 Separator (,), and (5) click OK.

After formatting, we have the following Descriptive Statistics Table, which has much better visibility:

5. How to calculate Descriptive Statistics in STATA:
To calculate Descriptive Statistics in STATA, the code is:
univar assts sales

- Correlation in Excel Data Analysis
- How to Find P-Value for Correlation in Excel
- Excel CORREL Function
- Excel CORREL Function MS Office Post
- Multiple Correlation in Excel Analysis Tool Pack
- Multiple Regression in Excel
- Predict a Variable based on other Variables in Excel Regression
- Scatter Plot of Multiple Series in Excel
- Stem and Leaf Plot in Excel and STATA
- Box Plot in Excel with Outliers
- Video on Descriptive Statistics in Excel
Good day! I could have sworn I’ve visited this site before but after going through some of the articles
I realized it’s new to me. Anyways, I’m certainly happy I stumbled upon it
and I’ll be book-marking it and checking back frequently!
Just wanna input on few general things, The website style and design is perfect, the written content is real good : D.