
Multiple Regression in Excel
Multiple Regression in Excel is used to predict a variable (Y) based on another variable (X) or variables (X’s). In statistics, regression analysis is used to estimate the relationships between a dependent variable and one or more independent variables. Linear regression analysis is the most common form of regression, in which a straight line that most closely fits the data according to specific criteria.
In this section:
- What is Regression Analysis?
- How to Perform Regression Analysis in Excel?
- Interpretation of Regression Output in Excel.
- How to Predict a Variable Based on Other Variables?
- How to Predict Net Income for year 2023 and 2024?

1. What is Regression Analysis?
Regression analysis is a statistical tool used to study the relationship between two or more variables. It is used to investigate how a dependent variable depends on one or more independent variables. Regression analysis attempts to determine how the dependent variable is related to a series of other changing variables.
The main objective of regression analysis is to express the response variable as a function variable of the predictor variables.
Let’s have an example of linear regression, which is a linear relationship between response variable, Y, and the predictor variable, Xi, i=1, 2…., n of the form
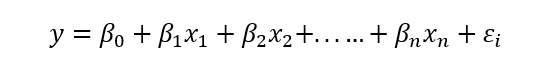
where, betas are the regression coefficients (unknown model parameters), and epsilon is the error due to variability in the observed responses.
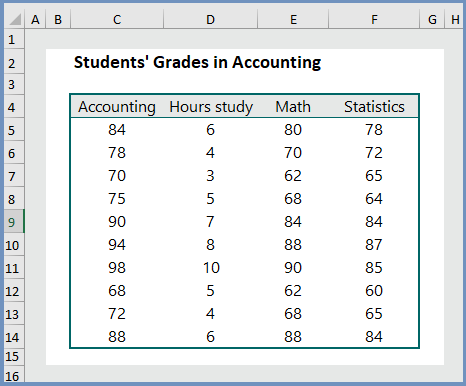
Example: Does the grade in accounting depend on grades in math and statistics and study hours?
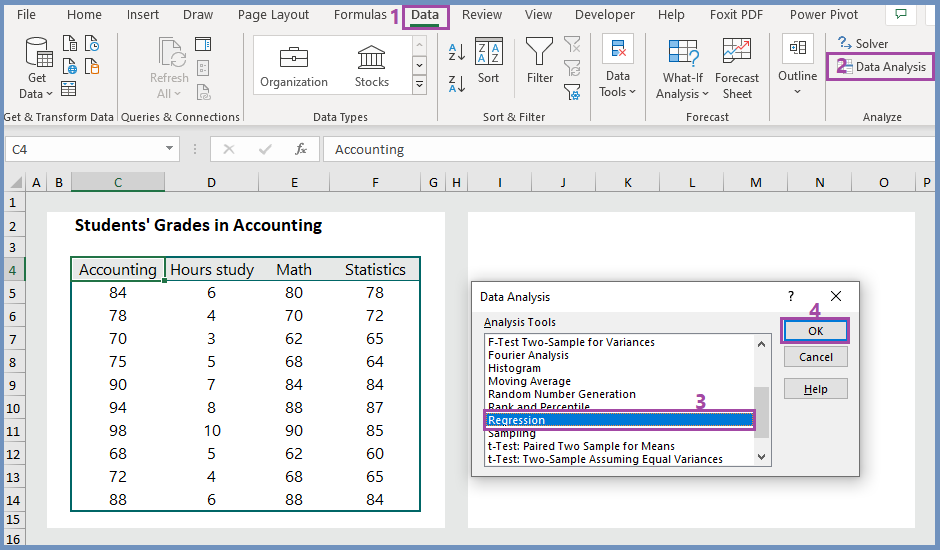
We want to investigate whether hours studied, math proficiency, and knowledge in statistics have impact on grades in accounting class. We have the data for 10 students in the following table.

The model based on our data:

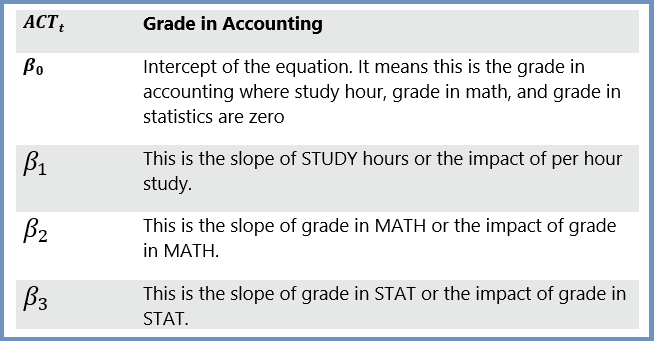
In plain English, the model suggests that the grade in Accounting is a function of study hours, grade in math, and grade in statistics.
2. How to perform Multiple Regression Analysis in Excel:
To perform regression analysis in excel, you have to use Analysis ToolPack, and follow the steps below:
Step 1: Open the data set –> Then click (1) Data Tab –> (2) click Data Analysis –> (3) select Regression –>click OK.
Step 2: Add input range:
We have two input ranges: (1) The dependent variable, Y, Grade in Accounting (C4:C14), and (2) the independent variables (D4:F14), X, Hours Study, grade in Math, and grade in Statistics..
In the Regression dialogue box, select C4:C14 as the Y Range, and select D4:F14 as the X Range. Check the Labels to display the names of the variables. In the output options, check New Worksheet Ply, which will returns the regression results in a new worksheet. Finally click OK.

After clicking OK, you will see the following table.

3. Explanation of the regression output in Excel:
Multiple R: 0.993: This is the multiple correlation between the dependent variable (Grade in Accounting) and three independent variables–Study hours, grade in math, and grade in statistics.
R-Square: 0.987: This is the percentage of the variance in the dependent variable explained by the independent variables. The R-Square value of 0.987 indicates that 98.7% of the variation in Accounting grade can be explained by the three variables. This R-Square is also called the coefficient of determination.
Adjusted R Square: 0.980. This R-Square value is adjusted for the number of independent variables in the model. This value is always smaller than the R-Square and will decrease when we use more independent variables.
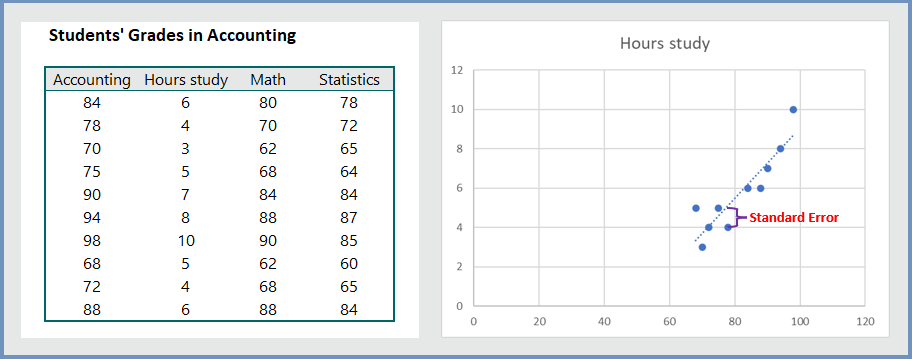
Standard Error: 1.492: This is the distance between the regression line and the observation values. In our example, the observed values fall an average of 1.492 units from the regression line.
Observations: 10. This is the sample size of the dataset used to run the regression. In our example, it is 10. Intercept: 19.490: The coefficient for the intercept. The value of 19.49 means that the expected grade in Accounting will be 19.49 for a student who studies zero hours, have zero in math and statistics.
Coefficients: The coefficients for each independent variable tells us the expected change in the dependent variable, assuming the other independent variable remains constant.
For example, for each additional hour of study, the average grade in accounting is expected to increase by 1.83, assuming other variables remain constant.
P-values: The P-values indicate whether each independent variable is statistically significant. In our example, we can see that Hours Study is statistically significant (p-value=0.01) while grade in Math is not statistically significant at alpha=0.05.
The Estimated Regression Equation:
Now, we can write the estimated regression equation from the regression output as follows:

We can now use the equation to predict the grade in Accounting based on the changes in Hours Study, grades in Math, and Statistics.
4. How to predict a variable based on other variables:
To predict a dependent variable based other independent variables, we have to follow two steps:
Step 1: Estimate the Regression Equation from past data:
We have the past data as follows (In the table below):
Now, we run the regression by using Analysis ToolPack. We have done so in section 2 above. Now, we have the following Estimated Regression Equation:

We are given the following inform to predict the grade in accounting class for 3 students:
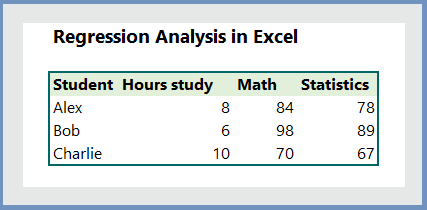
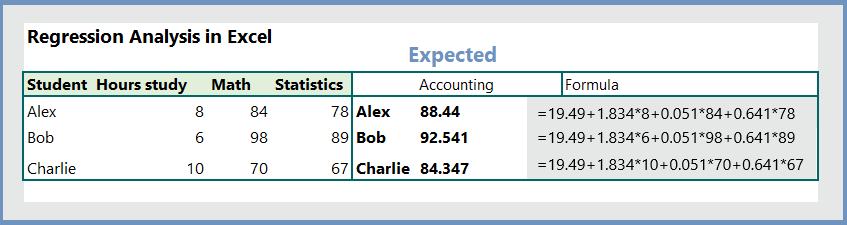
Step 2: Insert the values of independent variables to predict the grade in Accounting:
Now, we can insert the values in the equation and predict the grades in Accounting. For example, Alex’s grade is 88.444 and it has been calculated as follows:
=19.49+1.834*8+0.051*84+0.641*78
5. Predict Net Income for the year 2023 and 2024:
To predict a variable, we need to:
- Estimate the regression from historical data, and
- Have forecasted values of independent variables.
Let’s have an example data set, the company data. You can download the data from above link.
In the data set, we have financial information for the six variables as follows:
| Term | Definition |
| AT | Total Assets |
| CHE | Cash and Short-term Investment |
| COGS | Cost of Goods Sold |
| DP | Depreciation and Amortization |
| NI | Net Income (Loss) |
| SALE | Sales/Turnover |
These data are for the year 2021. We are also given the following estimated data for the year 2023 and 2024.
Requirements:
- What is the expected Net Income for the year 2023?
- What is the expected Net Income for the year 2024?
Answer: To answer these questions, we will follow two steps:
Step 1: Estimate the regression equation from historical data:
First, we need to run the regression to estimate the equation. To do so, (1) Data–> (2) Data Analysis –>(3) Input –> (4) check Labels –> (5) click OK.
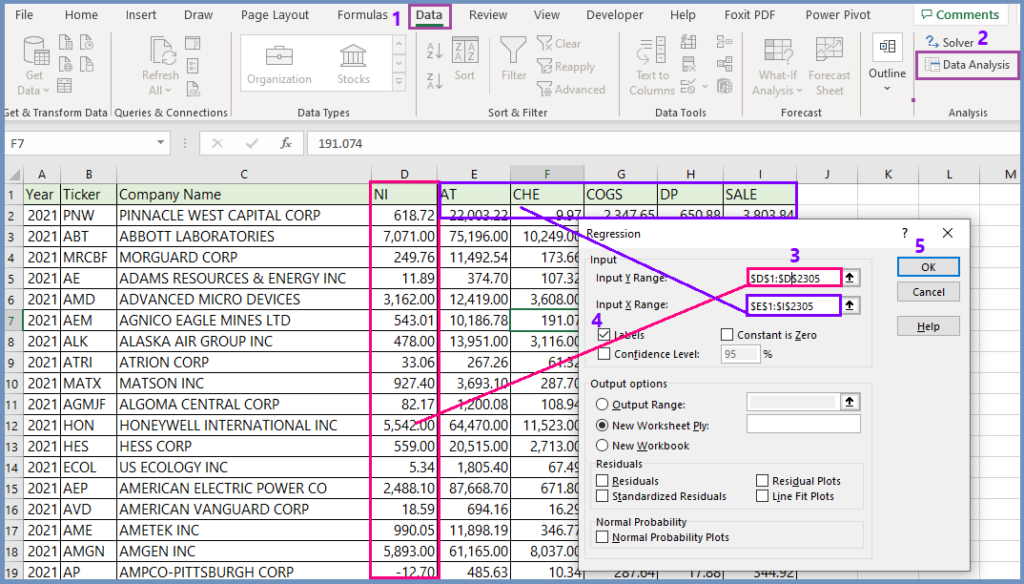
After clicking OK, we find the following regression output.

Now write the estimated regression equation:
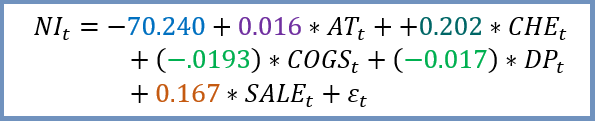
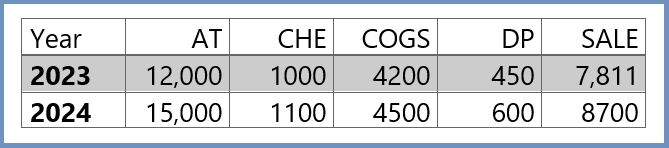
We are given the following forecasted data for the year 2023 and 2024. Based on these data, we need to calculate expected Net Income for the year 2023 and 2024.
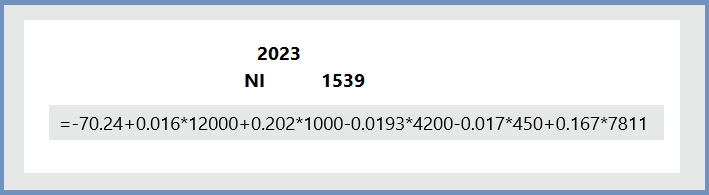
We calculate the expected Net Income for the year 2023 as follows:
Your job: Can you calculate the expected Net Income for the year 2024?
Related readings:
Some truly wondrous work on behalf of the owner of this web site, utterly outstanding content.
Thanks for your article. I would also like to say that a health insurance broker also works well with the benefit of the particular coordinators of a group insurance policy. The health agent is given a list of benefits looked for by anyone or a group coordinator. Such a broker can is look for individuals or maybe coordinators which in turn best go with those requirements. Then he reveals his suggestions and if the two of you agree, the broker formulates binding agreement between the 2 parties.
I do consider all of the ideas you’ve offered in your post. They are very convincing and will definitely work. Nonetheless, the posts are too brief for beginners. May just you please prolong them a bit from subsequent time? Thanks for the post.
Its such as you read my thoughts! You seem to understand a lot about this, like you wrote the e-book in it or something. I think that you could do with a few p.c. to power the message home a bit, but instead of that, this is great blog. A great read. I’ll certainly be back.
Heya i?m for the first time here. I came across this board and I find It really useful & it helped me out a lot. I hope to give something back and aid others like you aided me.
Hey very nice website!! Man .. Beautiful .. Amazing .. I’ll bookmark your blog and take the feeds also?I am happy to find so many useful info here in the post, we need work out more techniques in this regard, thanks for sharing. . . . . .
Thank you a lot for sharing this with all of us you really realize what you’re speaking approximately! Bookmarked. Please also seek advice from my website =). We could have a link exchange contract among us!
It?s really a great and helpful piece of info. I am glad that you shared this useful information with us. Please keep us up to date like this. Thanks for sharing.
excellent points altogether, you simply received a emblem
new reader. What could you suggest about your
submit that you made a few days in the past? Any sure?
Can I simply say what a relief to search out someone who truly is aware of what theyre talking about on the internet. You positively know the way to carry a problem to light and make it important. More folks must read this and perceive this facet of the story. I cant imagine youre not more fashionable since you positively have the gift.
Terrific work! This is the type of information that should be shared around the net. Shame on the search engines for not positioning this post higher! Come on over and visit my website . Thanks =)
Hello! I realize this is kind of off-topic however I had to ask.
Does operating a well-established blog such as yours take a large amount of work?
I am brand new to running a blog but I do write in my journal on a daily basis.
I’d like to start a blog so I can easily share my own experience and thoughts online.
Please let me know if you have any kind of ideas or tips
for new aspiring bloggers. Thankyou!
Good day! This is my 1st comment here so I just wanted to give a quick shout out and say I really enjoy reading your articles.
Can you recommend any other blogs/websites/forums that cover the same topics?
Thanks a ton!
Thanks for this excellent article. Yet another thing to mention is that many digital cameras can come equipped with any zoom lens that permits more or less of the scene to be included by ‘zooming’ in and out. These types of changes in {focus|focusing|concentration|target|the a**** length tend to be reflected inside the viewfinder and on massive display screen on the back of this camera.
In these days of austerity plus relative anxiousness about incurring debt, some people balk contrary to the idea of using a credit card in order to make acquisition of merchandise or perhaps pay for any occasion, preferring, instead just to rely on the particular tried and also trusted procedure for making repayment – hard cash. However, if you have the cash on hand to make the purchase fully, then, paradoxically, that’s the best time just to be able to use the cards for several causes.
I don?t even know how I ended up here, but I thought this post was great. I don’t know who you are but definitely you’re going to a famous blogger if you aren’t already 😉 Cheers!
Hello there, just became alert to your blog through Google, and found that it is truly informative. I am gonna watch out for brussels. I will appreciate if you continue this in future. Numerous people will be benefited from your writing. Cheers!
Thanks for your post. One other thing is the fact individual American states have their unique laws that affect homeowners, which makes it quite hard for the Congress to come up with the latest set of recommendations concerning foreclosure on property owners. The problem is that each state provides own legal guidelines which may interact in an undesirable manner on the subject of foreclosure insurance plans.
What i don’t understood is actually how you are not actually much more well-liked than you might be now. You’re so intelligent. You realize thus significantly relating to this subject, made me personally consider it from a lot of varied angles. Its like men and women aren’t fascinated unless it is one thing to do with Lady gaga! Your own stuffs great. Always maintain it up!
Thanks for your article. One other thing is individual American states have their particular laws that affect property owners, which makes it very, very hard for the Congress to come up with a different set of guidelines concerning home foreclosure on house owners. The problem is that each state has own laws and regulations which may interact in a damaging manner with regards to foreclosure guidelines.
Thanks for your article. I also think that laptop computers are getting to be more and more popular currently, and now are usually the only form of computer employed in a household. This is due to the fact that at the same time that they’re becoming more and more economical, their computing power is growing to the point where there’re as highly effective as personal computers coming from just a few years back.
Attractive section of content. I just stumbled upon your
site and in accession capital to assert that I acquire actually enjoyed account your blog posts.
Any way I’ll be subscribing to your feeds and even I achievement you access consistently rapidly.
I am very happy to read this. This is the type of manual that needs to be given and not the random misinformation that’s at the other blogs. Appreciate your sharing this best doc.
Thanks a lot for the blog article. Much obliged.
I am sure this piece of writing has touched all the internet viewers,
its really really pleasant piece of writing on building up new weblog.
constantly i used to read smaller posts that as well clear their motive, and that is also happening with
this article which I am reading here.
Open minded natural cam girls looking for her knight ! are you?
Can I simply just say what a comfort to discover a person that truly
knows what they’re talking about on the internet. You
actually understand how to bring a problem to light and make it important.
A lot more people need to read this and understand this side of your story.
It’s surprising you aren’t more popular because you surely have the gift.
My family all the time say that I am killing my time here at web, but I know I am getting know-how daily
by reading such pleasant articles or reviews.
Itz Grippy TV OnlyFans Mega Link Download ( Visit https://archiver.fans )
Bulma XO OnlyFans Mega Link Download
Only Fans Leaks Free Download
Leah Mifsud OnlyFans Mega Link Download ( Visit https://archiver.fans )