Stem and Leaf in Excel and STATA
In this section:
A Stem and Leaf plot displays the the first digits of the number as the stem and displays the last digit as leaf. The main purpose of the Stem and Leaf plot is to show which first digit has the highest and lowest presence in the data set. For example, if the leaf of Stem 3 is longer than other stems, we can say that more numbers in the data are between 30 and 39. In the Stem and Leaf plot, any value with decimal points are usually rounded to the nearest numbers. We can prepare Stem and Leaf plot in Excel and STATA.
- What is Stem Leaf?
- What does Stem and Leaf Tell Us?
- How to Prepare Stem and Leaf in Excel?
- How to Prepare Stem and Leaf in STATA?
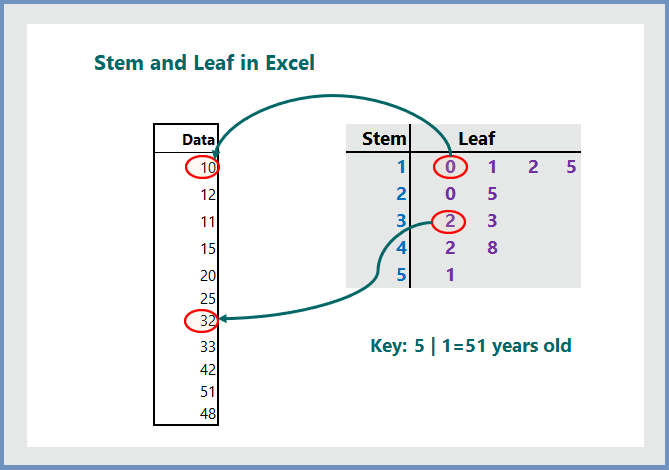
1. What is Stem and Leaf?
A Stem and Leaf plot in statistics is a special type of table that list each data value in split format into “Stem” (usually the first digit or first digits) and a “Leaf“(usually the last digit). From the Stem and Leaf, we can easily check which data value(s) are higher in our data set.
Example:

- Stem “1” of Leaf “0” means 10
- Stem “3” of Leaf “2” means 32
2. What does Stem and Leaf Tell Us?
The Stem and Leaf is a special table where each data value is split into a “stem” (the first digit or digits) and a “leaf” (usually the last digit). From the stem and leaf plot, we can quickly find:
- which numbers are more in the data set
- which numbers are less frequent
- the speeds, test results, and weights.
3. How to Prepare Stem and Leaf in Excel:
To prepare the Stem and Leaf plot in Excel, follow the steps below:
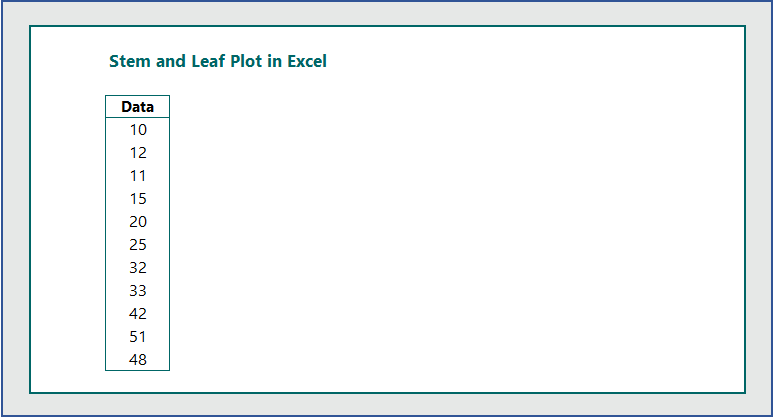
Step 1: Enter the data into Excel cell:
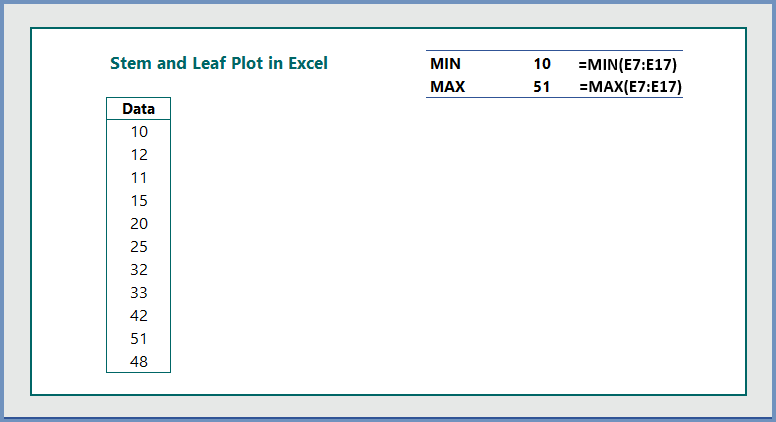
Step 2: Calculate the Minimum and Maximum Values:
Step 3: Based on the minimum and maximum values, enter the Stems manually:
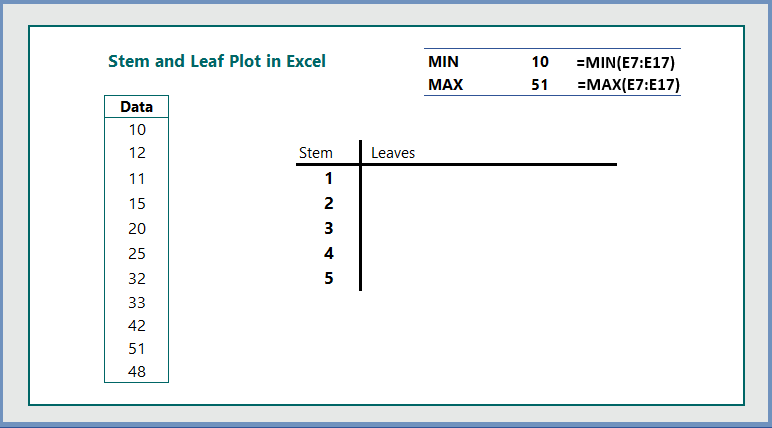
Step 4: Write the following formula in cell H8 to calculate the leaves for stem 1:
Write the following formula in cell H8 and hit enter.
=REPT(“0”, COUNTIF($E$7:$E$17,H9*10+0))&REPT(“1”, COUNTIF($E$7:$E$17,H9*10+1)) &REPT(“2”, COUNTIF($E$7:$E$17,H9*10+2))&REPT(“3”, COUNTIF($E$7:$E$17,H9*10+3)) &REPT(“4”, COUNTIF($E$7:$E$17,H9*10+4))&REPT(“5”, COUNTIF($E$7:$E$17,H9*10+5)) &REPT(“6”, COUNTIF($E$7:$E$17,H9*10+6))&REPT(“7”, COUNTIF($E$7:$E$17,H9*10+7)) &REPT(“8”, COUNTIF($E$7:$E$17,H9*10+8))&REPT(“9”, COUNTIF($E$7:$E$17,H9*10+9))

Step 5: Now double click on “Fill Handle” to copy the formula down to other cells.
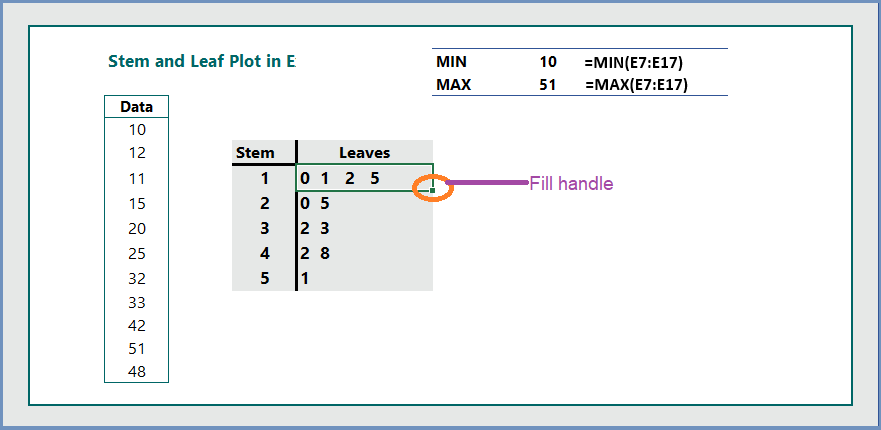
Once you are done with creating the stem and leaf plot, make sure the following things are right:
Minimum Value: Check the stems and leaves whether there is any number less than the minimum value of 10. In our example, the minimum value we can see the stem 1 and leaf 0, which is 10. There is no other number less than 10.
Maximum Value: Check the stems and leaves for the maximum numbers. We can see that the maximum number is 51, which is the combination of stem 5 and leaf 1. There is no other number greater than 51.
The number of observations: Count the number of observations and match them with the leaves. In our example, we have total 11 observations. Our total leaves are also 11, indicating that we have done correctly.
4. How to prepare Stem and Leaf plot in STATA:
To prepare the stem and leaf plot in STATA, the formula is:
stem var

Notes:
Stem-and-leaf plot for v1
stem v1
As above, with 2 lines per interval of 10
stem v1, lines(2)
Specify that each stem has a width of 5 (equivalent to above)
stem v1, width(5)
Stem-and-leaf plot for v2 with an interval of 100
stem v2, digits(2)
As above, with 4 lines per interval of 100
stem v2, digits(2) lines(4)
Display v2 rounded to the nearest hundred
stem v2, round(100)
Do not display empty stems
stem v2, prune
Further readings:

I haven?¦t checked in here for some time as I thought it was getting boring, but the last few posts are great quality so I guess I will add you back to my everyday bloglist. You deserve it my friend 🙂