
Benford’s Law in Excel
Benford’s Law in Excel is used frequently. Benford’s Law, also known as the first-digit law, is an observation that the leading digit in many real life numerical data set is more likely to be smaller. In the number set, which conforms with this law, the number 1 appears as the leading significant digit about 30% of the time, then the number 2 as the second leading digit appears about 17% of the time, whereas the number 9 appears as the leading digit less than 5% of the time. Normally, we think that all the numbers from 1 to 9 should occur uniformly, 11.1% of the time. But the BenFord’s Law suggests that as the leading digit the number 1 occurs more frequently than the number 2, the number 2 occurs more frequently than the number 3, and so on. If you check the population by country, you will notice that the number 1 appears as the leading significant digit about 30% of the times. Users can easily prepare Benford’s Law in Excel.
In this section:
- Statement of the Benford’s Law
- How to prepare Benford’s Law Curve in Excel (Net Income Example).
- Shortcut way to prepare Benford’s Law in Excel.

1. Statement of the Benford’s Law:
A set of number will satisfy the law of Benford’s Law if the leading digit d occurs with the probability of
p(d)=log10(d+1)-log10(d)=log10{(d+1)/d}=log10 {(1+(1/d)}
where the leading digit has the following distribution:

How Benford’s Law detect Fraudulent Activities:
The US General Accounting Office (GAO) estimates that fraud accounts for up to $100 billion in the United States (GAO, 1997). There is a tremendous improvement in technology in the last decade, and it has become increasingly possible to analyze huge amounts of data to detect trends in accounting numbers; therefore, the use of Benford’s Law has become feasible. Since the leading digit in natural numbers follow the distribution of Benford’a Law, it can be used to detect abnormalities in the numbers. Benford’s Law is frequently used in detecting Financial Accounting Fraud, fraudulent insurance claims, and fraudulent expenses reported by managers. That is why the Benford’s Law in Excel has become popular.
Benford’s Law does not apply to all situation:
Benford’s Law cannot be applied to numbers that are influenced by human interactions such as ATM withdrawals. The data is assumed not to have an arbitrary cutoff, which delete some data values and make the data analysis invalid. The Benford’s Law does not also work in preassigned numbers such as area codes, telephone codes or personal identification numbers. Benford’s law in Excel is popular because of its easy to use.
2. Preparing Benford’s Law Curve for Net Income:
To prepare the Benford’a Law Curve, we need to follow steps below: [We are using the data set “Benford’s Law data“, which you can download from Download File button.]
Step 1: Calculate the first digit of the Net Income Number:
In the column F (named NI First Digit), we write the formula =LEFT(E5,1), which returns the first digit of the Net Income numbers.
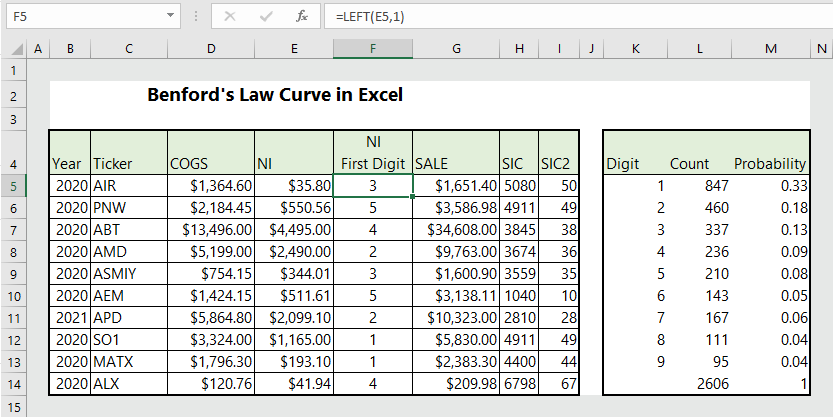
Step 2: Count the number of digit in the data set:
In this step, we need to count the frequency of the leading digits. To do so, we have first named the column “NI First Digit” as nifd. Then we write the formula (in cell L5) =COUNTIF(nifd, K5:K13), which counts the presence of the digit in the entire data set. We then drag down the formula, which spills over the cells below L5 and automatically counts the number of other digits.

Step 3: Calculate the Probability of the digit:
To calculate the probability, we first add the total count, which is 2606 in our example. Next, divide the count of each digit by the total (2606). For example, for the digit 1, we write (in cell M5) =L5/L14, for the digit 2, we write (in cell M6) =L6/L14, and so on.
Step 4: Open the probability data with Pivot Table:
Select the range of cells (in our example, K4:M13), then click on Insert tab (2 in image below), and click Pivot Table (3 in image below).
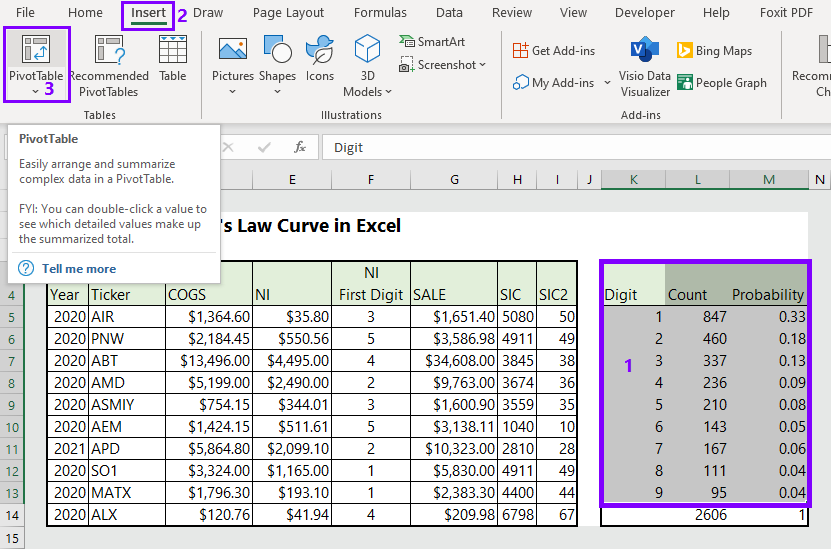
After clicking on Pivot Table in 3 above, you will see the following dialogue box.

Now click OK.
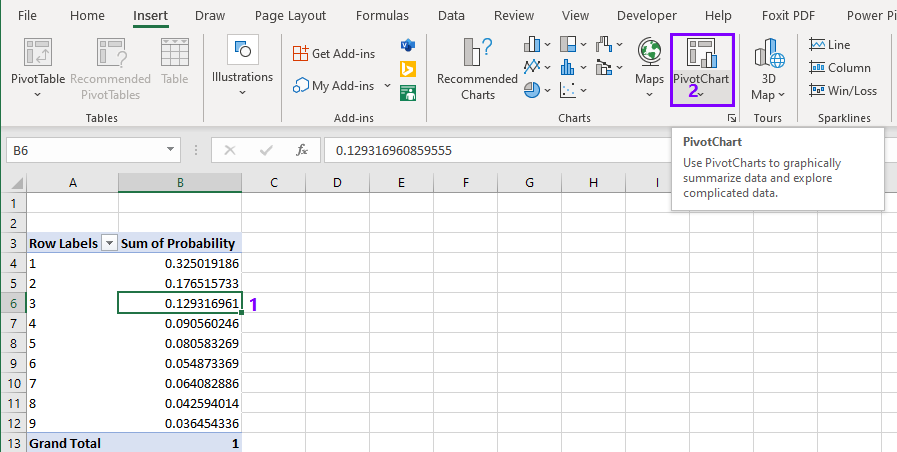
Step 5: Drag the Digit to Rows, and Probability to Values:
After opening the table in Pivot Table, your job is to drag the Digit to Rows (as shown below) and Probability to Values.

Step 6: Insert Pivot Chart:
We are almost there. In this step, just select any cell of the Sum of Probability–> then click on PivotChart.
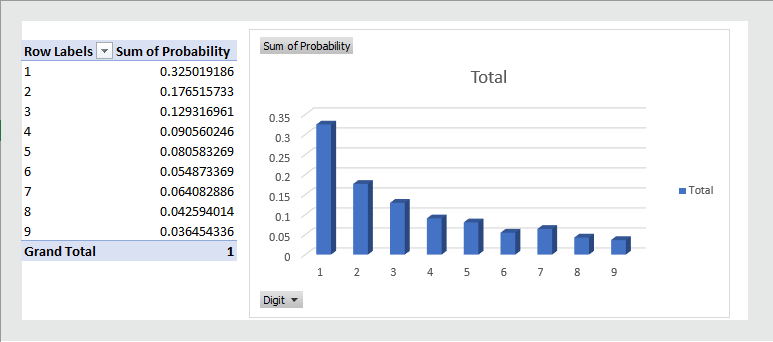
Step 7: Insert the 3-D stacked Column chart:
After clicking on PivotChart, the Insert Chart dialogue box will be presented. Your job is to select the type of chart. For Benford’a Law, the 3-D Stacked Column is more appropriate.

Step 8: Finally click OK to insert the chart:
After clicking OK, you will see the following Benford’s Law Curve. Now you can copy the curve and paste it on MS Word file. While pasting the file on MS Word for reporting purpose, it is better to paste as image because normal pasting will be aligned with the change in the data. If the data changes, the curve will also be changed.
3. Shortcut way to prepare Benford’s Law in Excel:
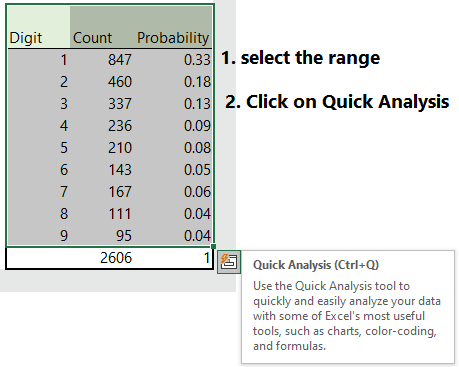
The easiest way to insert Benford’s Curve in Excel is to use Quick Analysis.
Step 1: Select the range of the data you want to analyze–> then click on Quick Analysis.
Step 2: Click on Quick Analysis–> then click on Charts.
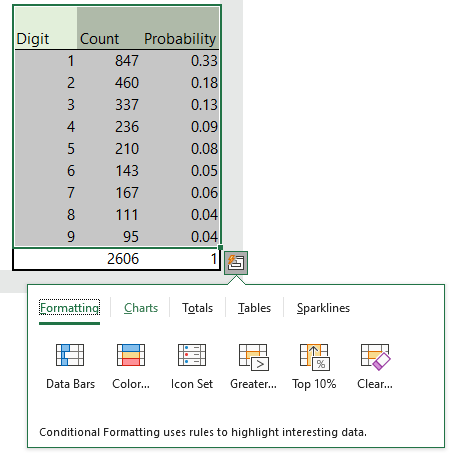
Step 3: After clicking on Charts-> click on Clustered.

Step 4: Select the style of Chart:
After clicking on Clustered, you will be given different options of chart styles. Your job is to select the one you like to present. We have selected the style 14 in the image below.

More related readings:
F*ckin’ remarkable things here. I’m very happy to see your article. Thank you a lot and i am having a look forward to touch you. Will you kindly drop me a mail?