
Perform Quick Analysis in Excel
Sometimes, you need to quickly analyze performance of your own or of your employees. To do that you can use the Excel Quick Analysis tool. The quick analysis in Excel is powerful tool, which gives you the visual presentation of progress. Questions answered in this section on Quick Analysis in Excel.
- What is Quick Analysis in Excel?
- List of Quick Analysis in Excel.
- Different Types of Quick Analysis with Examples.
- Conclusion.
- What is Quick Analysis in Excel:
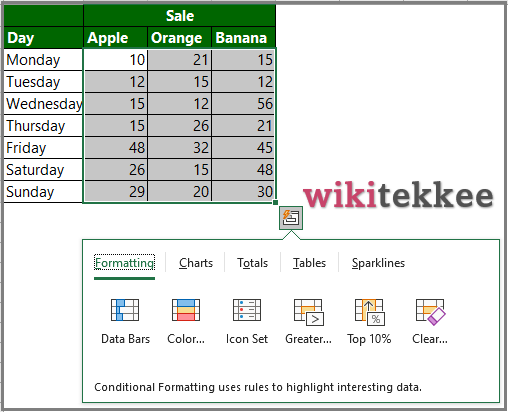
Quick analysis in Excel is a tool that helps users to quickly analyze the performance of self tasks or others. Users can easily perform the analysis by simply selecting the range that they want to analyze. Any selected range can be analyzed by using this tool.

2. List of Quick Analysis in Excel:
The Quick Analysis can perform the following analysis:
- Formatting
- Charts
- Totals
- Tables
- Sparklines
3. Different Types of Quick Analysis with Examples:
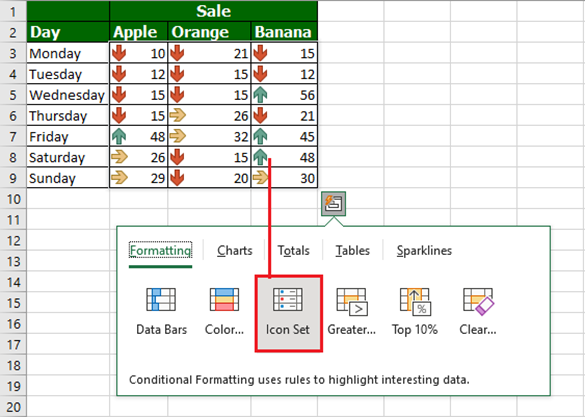
1. Formatting: There are different types of formatting analysis. Let’s see the examples of each of them:
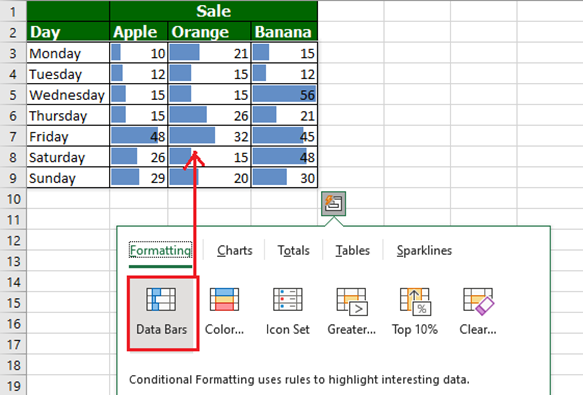
Data Bars:
It shows the length of the values in ever cell, which helps you to visually check which cell has the highest value, indicating highest performance.
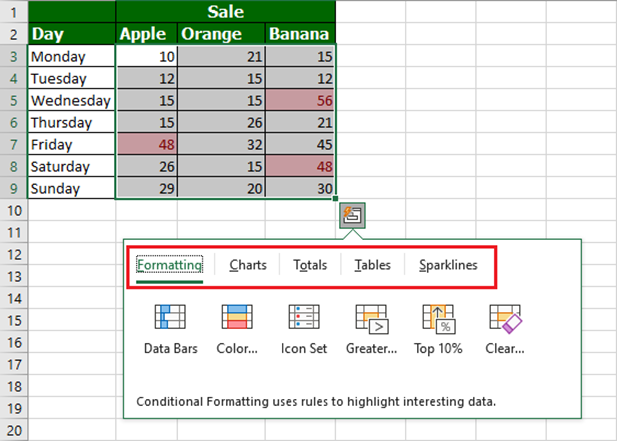
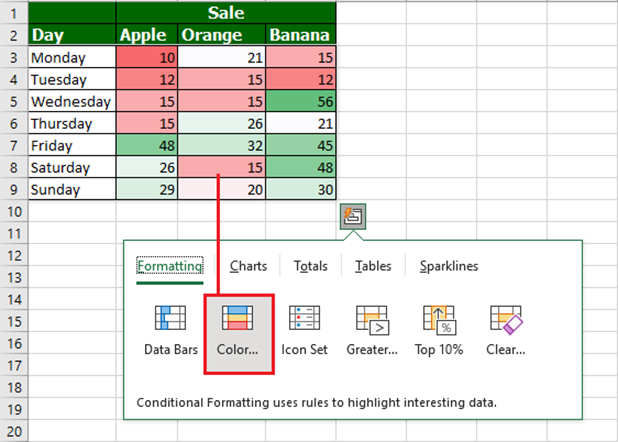
Colors: The coloring format helps users to check the values. Highest valued cells are colored greener and the lowest valued cells are more red.
Icon set: It helps users to see the trend of the values of every single cell.
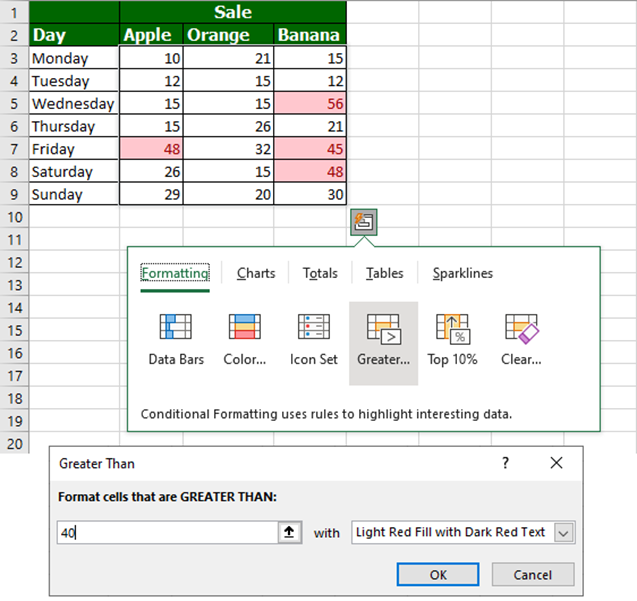
Greater: This helps you to see the data greater than a certain value. In our example, we have selected the value 40 and can see the values greater than 40.
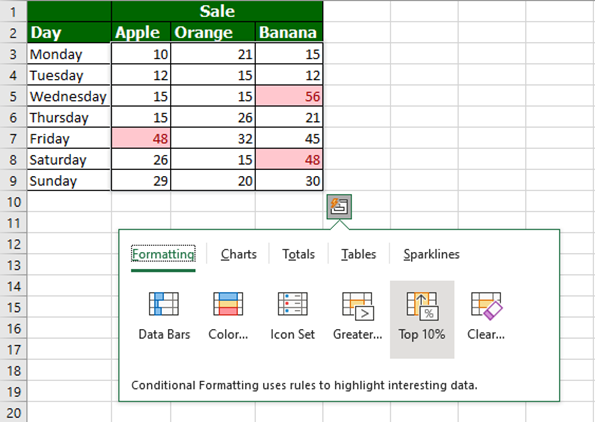
Top 10%: By using this analysis, we can see the top 10% of the values.
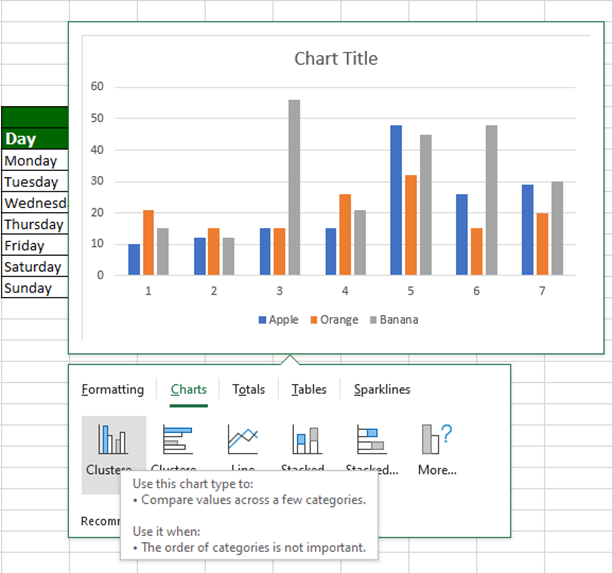
2. Charts:
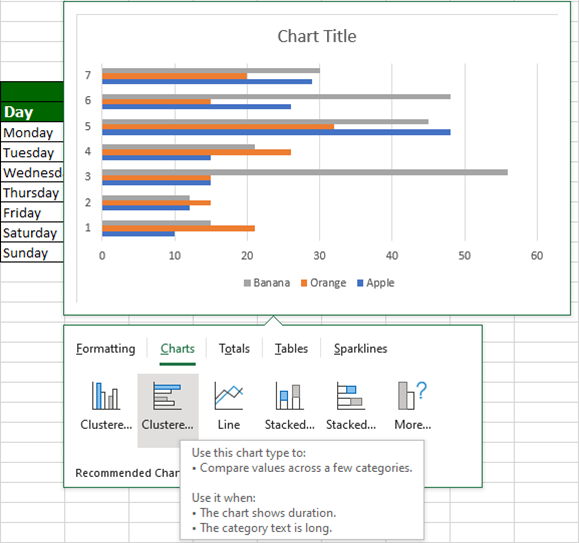
Cluster: When you click on Charts from the Quick Analysis, can see six different options. Use the first cluster to compare values across different categories. Use this analysis when the order of category is NOT important.
Cluster 2: Use this analysis to compare values across different categories. When the chart shows duration and category text is long, you may like to use this analysis.
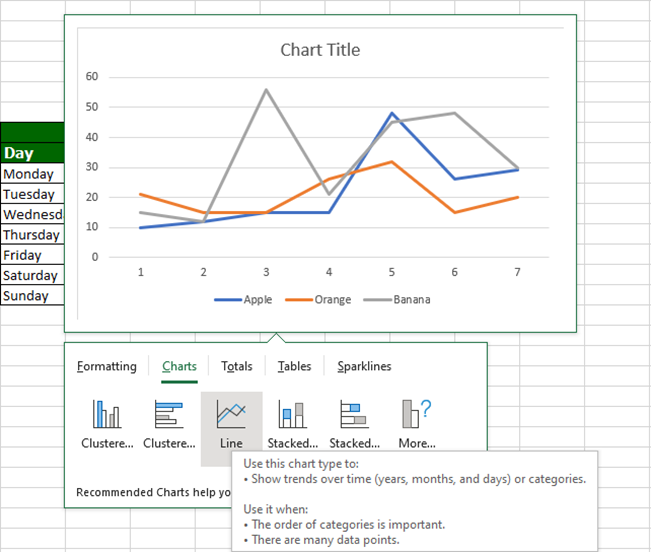
Lines: The line chart shows the trends of the data over time such as years, months, and days as well as categories.
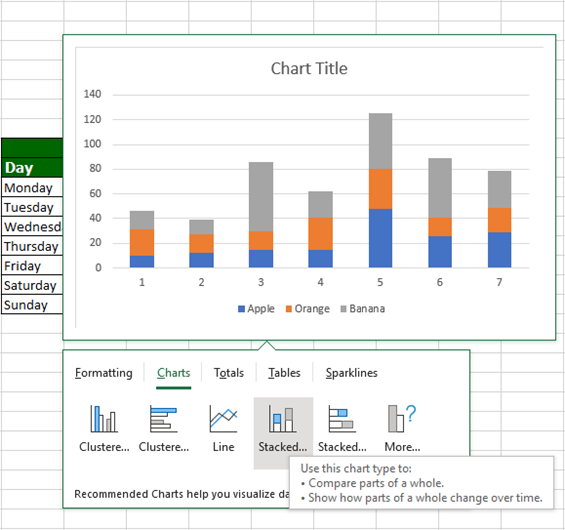
Stacked: Excel users use this chart type to compare parts of the whole and show how the parts of the whole is changing over time.
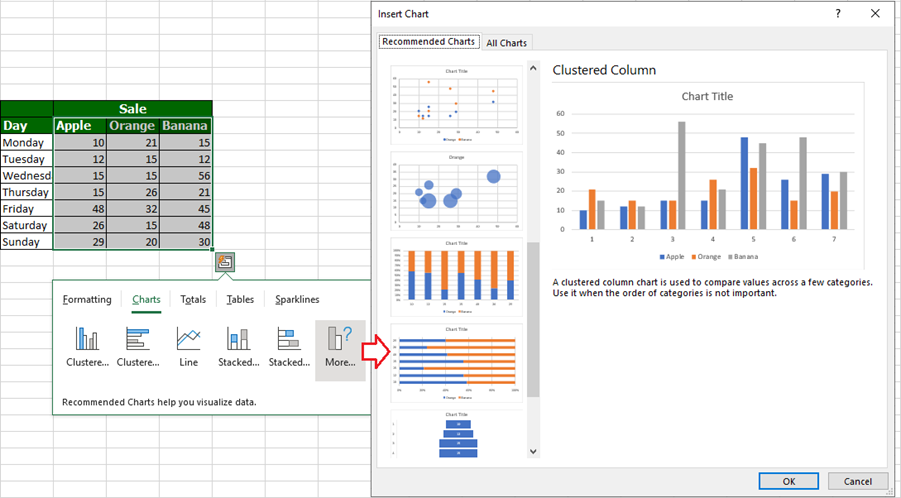
More Charts: For more charts analysis, click more and you can select as you want. You can select one from the recommended charts or look at all the charts then select one you like.
3. Totals Analysis:
The most important part of the Quick Analysis is the Totals analysis. It helps users to analyze by column or by row.
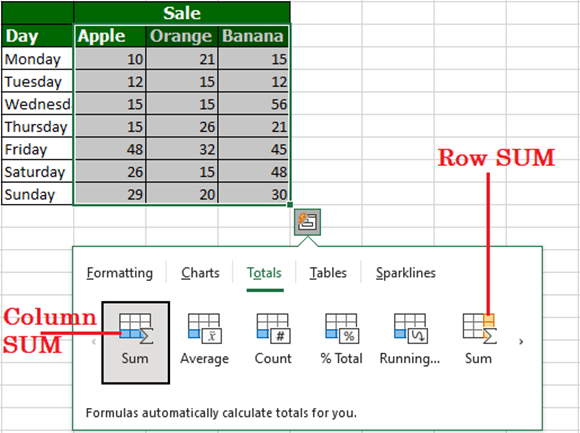
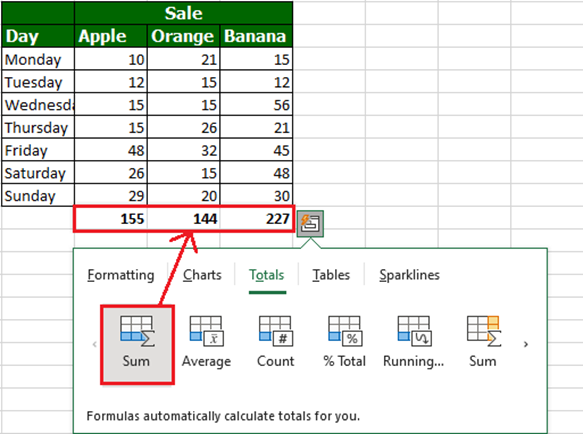
Column SUM: This generates the column SUM.
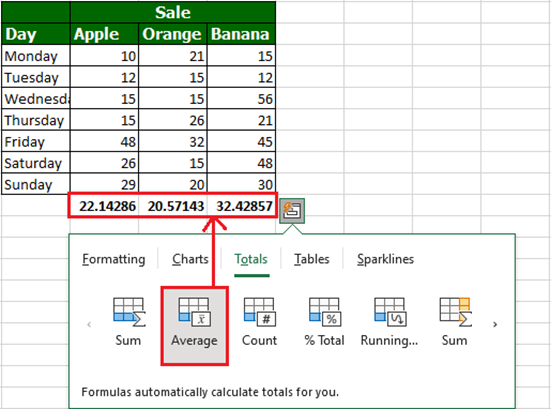
Column Average: This populates the column average.
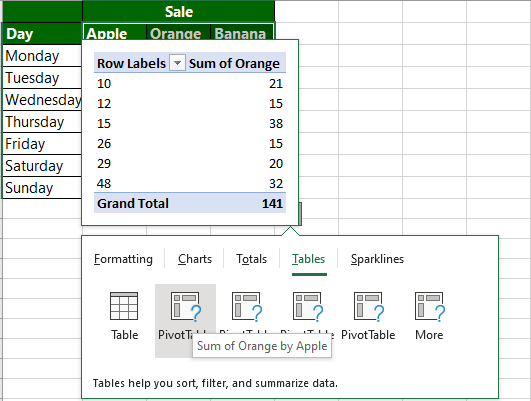
4. Tables: Users can easily insert different Tables for further analysis.
Pivot Table: Table–> Pivot Table.
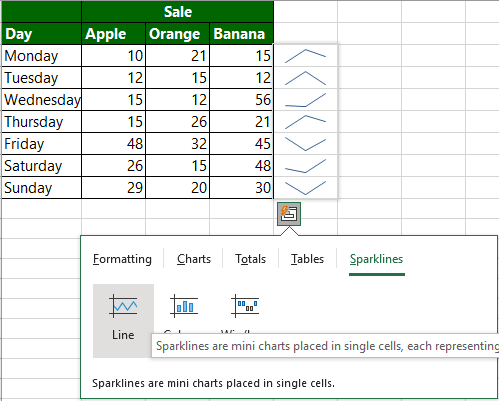
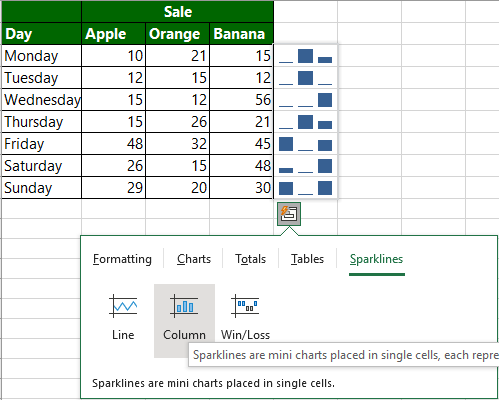
5. Spraklines: It helps to see the trend of the values in every row.
Line:
Column:
Conclusion:
Users can use the Quick Analysis Tool Pack for making better decision by simply selecting the range of cells. It helps them to perform better in future.
More related posts:
Beginners’ Posts
Whats Taking place i’m new to this, I stumbled upon this I have found It positively helpful and it has helped me out loads. I hope to contribute & aid other customers like its helped me. Good job.