
Creating a Correlation Matrix in Stata: A Step-by-Step Guide
In this post, we discuss on Creating a Correlation Matrix in Stata: A Step-by-Step Guide. Correlation matrices are a useful tool for understanding the relationships between multiple variables in a dataset. In this post, we will discuss how to create a correlation matrix in Stata, a popular statistical software package.
Step 1: Prepare your data Before creating a correlation matrix, you will need to make sure your data is in a suitable format. You should have a dataset with multiple variables that you want to investigate the relationships between. Each variable should be in a separate column and each observation should be in a separate row.
//Get data from STATA data store//
. sysuse auto
//Estimate all pairwise correlations//
. pwcorr price headroom mpg displacement
//Add significance level to each entry//
. pwcorr price headroom mpg displacement, sig
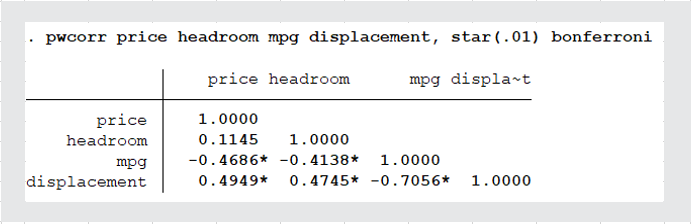
//Add stars to correlations significant at the 1% level after Bonferroni adjustment//
. pwcorr price headroom mpg displacement, star(.01) bonferroni
Step 2: Load your data To load your data into Stata, you can use the “use” command, followed by the name of your data file. For example, if your data file is called “mydata.dta”, you would type “use mydata.dta” into the command line.
Step 3: Run the correlation command To create a correlation matrix, you will need to run the “pwcorr” command. This command takes the form “pwcorr var1 var2 var3 … varN”, where “var1”, “var2”, “var3”, etc. are the names of the variables you want to include in the matrix. For example, if you have three variables called “x”, “y”, and “z”, you would type “pwcorr x y z” into the command line.
Step 4: Interpret the results The results of the “pwcorr” command will be displayed in a table, with the variables listed in the rows and columns. The diagonal of the table will be filled with 1s, since a variable is perfectly correlated with itself. The other cells in the table will contain the correlation coefficient between the two variables. Correlation coefficients range from -1 to 1, where -1 indicates a perfect negative correlation, 0 indicates no correlation, and 1 indicates a perfect positive correlation.
In addition to the pwcorr command you can also use the corr command which is a more flexible and has more options to customize the output matrix.
In conclusion, creating a correlation matrix in Stata is a simple process that can help you understand the relationships between multiple variables in your dataset. By following the steps outlined in this post, you can easily create a correlation matrix and interpret the results to gain insight into your data.